The Challenge
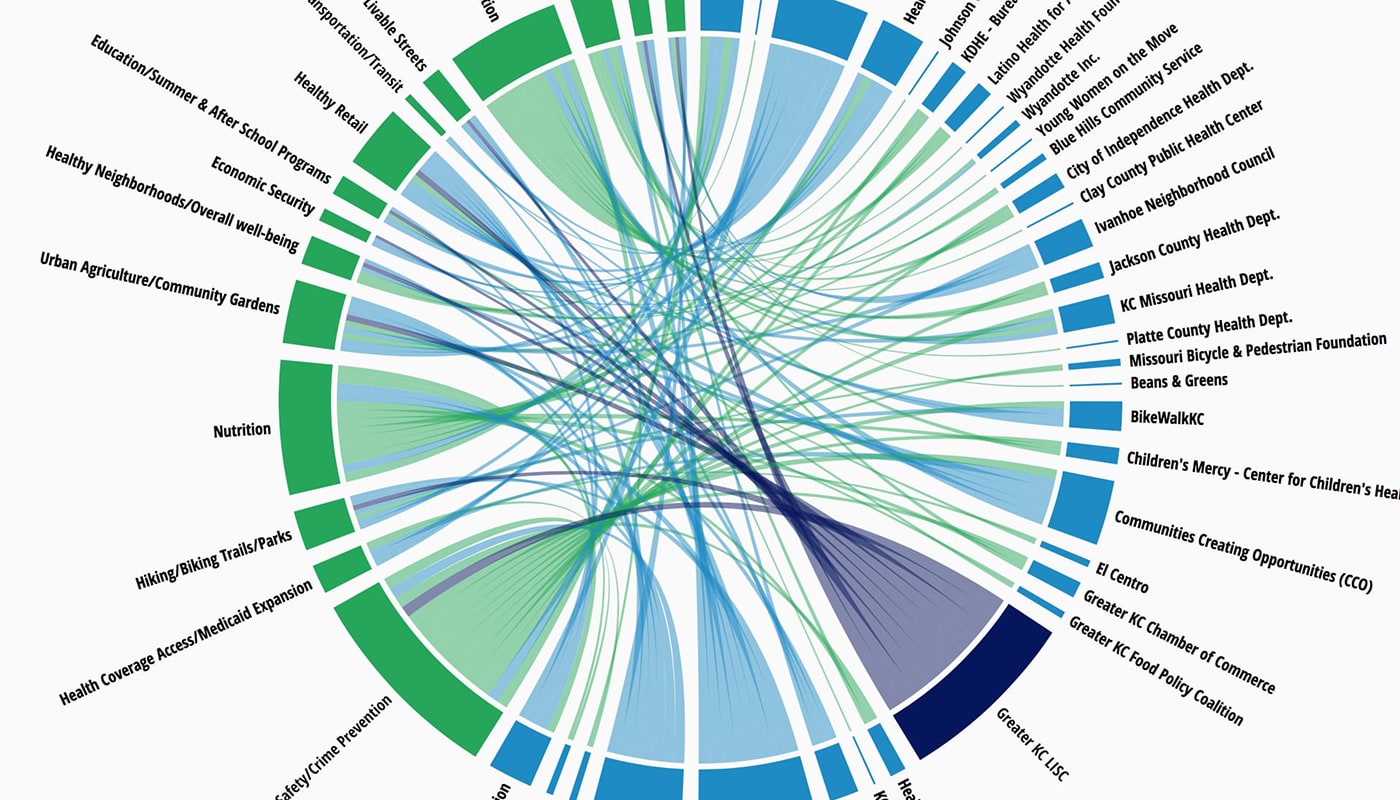
Initially, we were asked to create a network diagram, but as we looked through the data provided, we realized a network diagram would result in an extremely complex visual, making it difficult for viewers to understand and difficult to update in the future.
The Solution
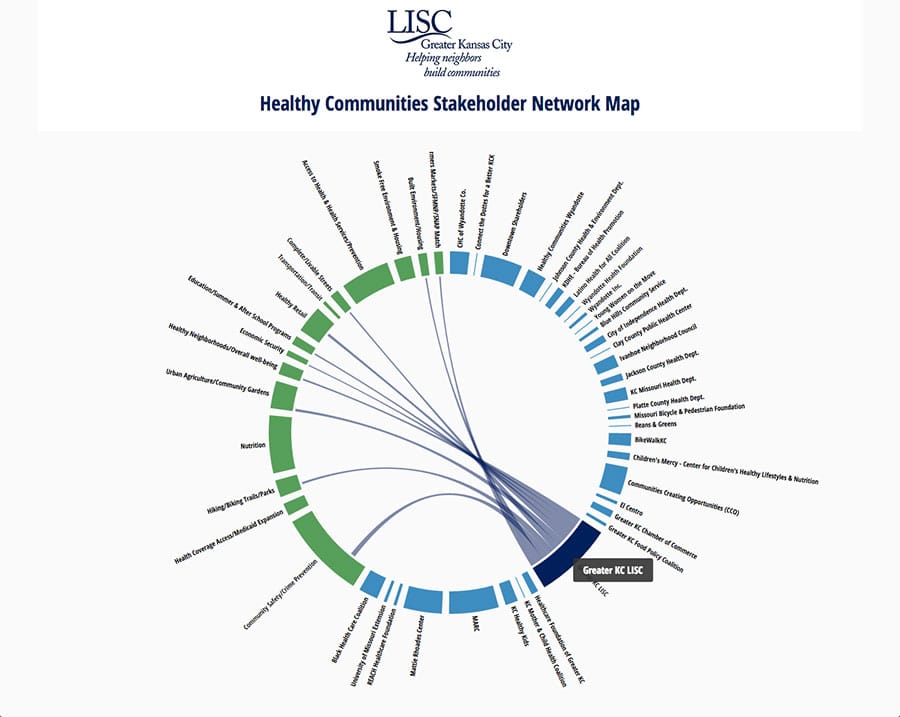
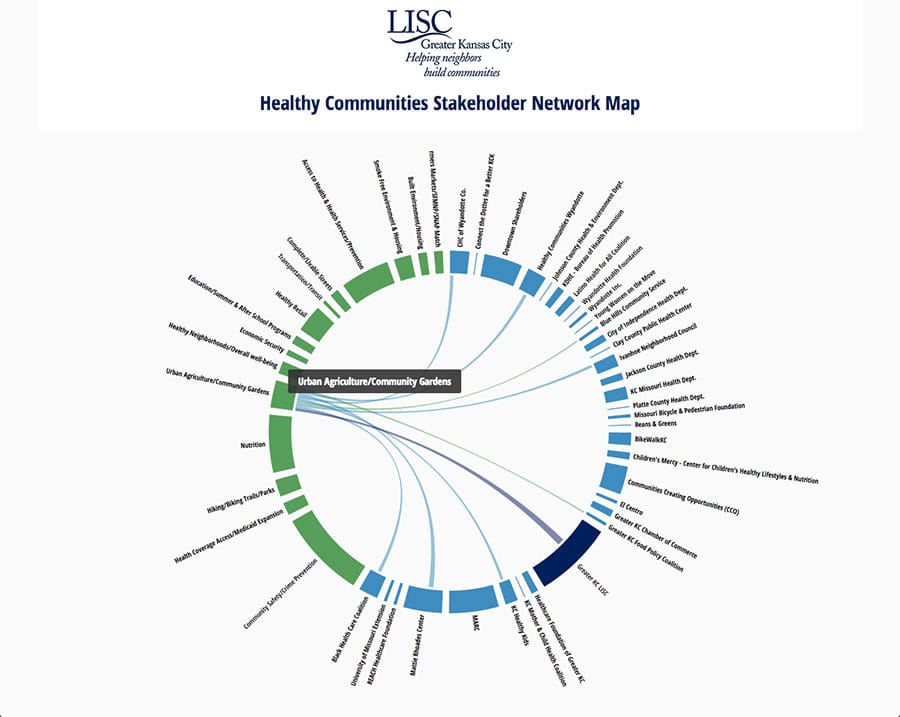
We created an engaging data visualization by using d3js, a JavaScript library that enables relatively simple and flexible visualization of complex data. d3 provides the added benefits of being maintainable, functional across mobile and desktop devices, and offers the ability to export vector graphics that can be reproduced in print.
View the live version